European Single Market Scoreboard 2021

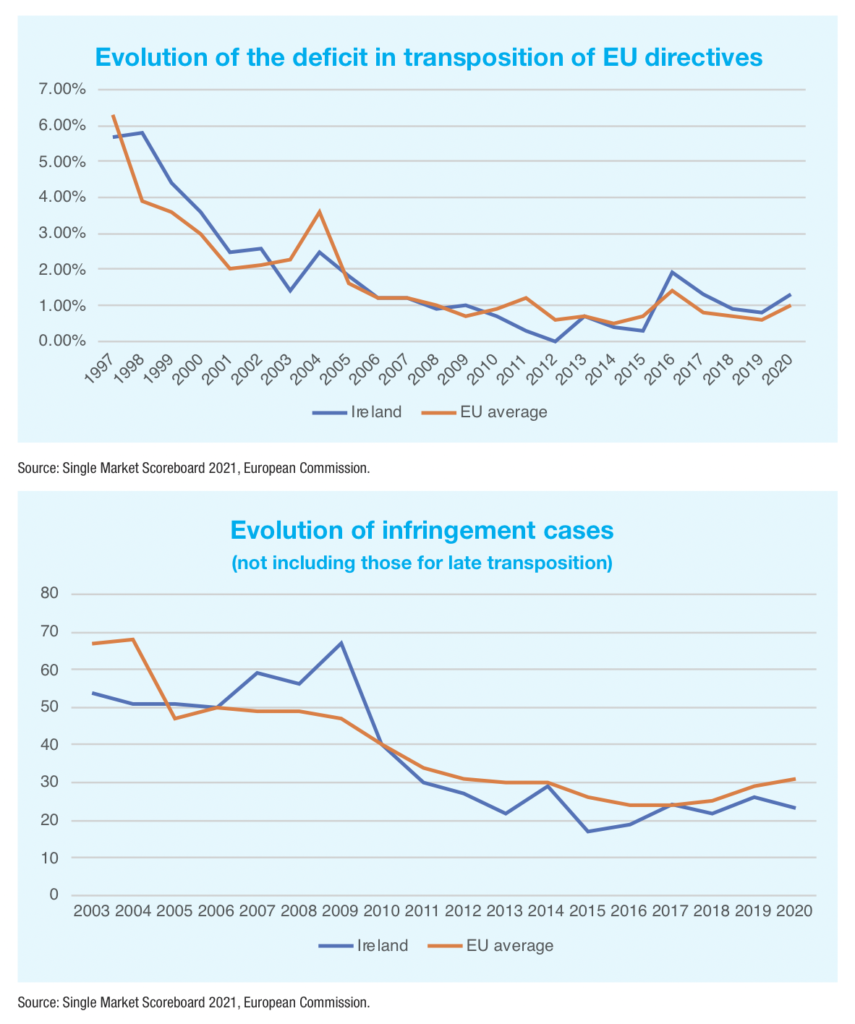
The European Commission’s Single Market Scoreboard measures the performance of the single market, and the performance of member states within the market. Its 2021 edition finds Ireland in a deficit of transposing directives into law but performing well in reducing its single market-related pending infringement cases.
Transposition
Ireland’s transposition deficit for 2020, as included in the 2021 scoreboard, stands at 1.3 per cent, a 0.5 percentage point increase from 2019’s 0.8 per cent, making the State one of 11 EU member states whose increasing deficit over 2021 brought them over the EU target and average of 1 per cent. The proposed target in the Single Market Act is 0.5 per cent.
With 13 overdue directives, an increase of five was recorded. One directive, 2014/52/EU on the assessment of the effects of certain public and private projects on the environment was found to be three-and-a-half years overdue, a figure which greatly distorted the average delay of transposition. The average was found to be 12.2 months, which was a five-month decrease from 2020 nonetheless, although still markedly above the EU average of 7.4 months.
Ireland has also recorded its largest ever conformity deficit of 1.3 per cent, with 13 directives presumed to have been incorrectly transposed. While this represents a 0.2 percentage point increase from 2019, it is below the EU average of 1.4 per cent. The proposed target for this area under the Single Market Act is again 0.5 per cent.
Infringements
With 23 single market-related pending cases, Ireland is one of just five member states to have reduced their number of cases within the year 2020. The EU average stands at 31 and Ireland has now not exceeded the average in this regard since May 2010. 2020 saw the launching of 198 new cases in Europe, not including those for late transposition; only three of these were against Ireland, the lowest number among member states and well below the average of seven.
Ireland’s most problematic sectors were found to be environment (eight pending cases, including four on water protection and management) and transport (four pending cases). Ireland is however the member state with the second longest average duration of cases, 51.6 months for the 21 single market-related cases not yet sent to the European Court. The EU average stands at 37.3 months. One-third of Irish pending cases have been pending for between six and 15 years.
Ireland recorded the second biggest decrease in average time to comply with court rulings, from 47.5 months in 2019 to 27.4 months in 2020. The EU average was 31.7 months for 2020. This decrease is mainly due to the fact that four cases are now more than five years old and are no longer part of the calculation.
Internal Market Information System
Ireland’s performance within the Internal Market Information System was found to be “excellent”, with all five indicators showing performance above the EEA average and four indicators (requests accepted within one week, requests answered by the deadline agreed, satisfaction with timeliness of replies as rated by counterparts, and satisfaction with efforts made as rated by counterparts) showing improvement. Ireland’s speed in answering requests did decrease, from nine days to 12, but still remained under the EEA average of 15.

Trade in goods and services
Ireland recorded a high level of trade integration in the single market for services, with intra-EU trade integration for services accounting for 25.3 per cent of GDP in 2019, an increase of 5.1 per cent. Conversely, trade integration for goods decreased from 2018-2019, falling 8.3 per cent to account for 21.6 per cent of GDP.
Intra-EU imports in services also increased, by 5.6 per cent, accounting for 22.3 per cent of GDP. Again, imports in goods fell, by 6.4 per cent, to account for 17.4 per cent of GDP.
Foreign direct investment
2019 saw Ireland disinvesting from other EU countries and other EU countries disinvesting from Ireland, in both cases at lower levels than 2018. Intra-EU FDI flows showed year-on-year changes of 0.84 per cent inwards and 0.70 per cent outwards. The value of Ireland’s FDI stock in other countries rose by 0.15 per cent in the same period, with the value of EU countries’ FDI stock in Ireland falling by 0.13 per cent.
2019 also saw Ireland disinvesting from non-EU countries, while FDI into Ireland from non-EU countries also decreased. Extra-EU FDI flows decreased by 0.37 per cent inward and 1 per cent outward. The stock value for extra-EU FDI investments rose by 0.24 per cent inward and 0.13 per cent outward.


